
A forecast begins with a belief about useful work
The difficult part of forecasting Physical AI is deciding what must become true before customers will put robots to work at scale. A shipment curve toward 2035 may assume reliable manipulation, affordable support, sufficient utilisation and an operating model that customers accept. Small changes in those assumptions can produce very different markets.
A warehouse manager may value predictable throughput above flexibility. A manufacturer facing frequent product changes may pay for adaptability. A service operator may care most about recovery when something goes wrong. Each decision reflects a particular task, alternative and economic constraint. A forecast becomes more useful when it makes these choices visible.
Hypotheses are the foundation of a forecast because they expose the conditions on which its numbers depend. They also make disagreement productive. Two people can reach different estimates because they expect different costs, adoption barriers or customer behaviour. Identifying that difference creates something that can be investigated.
For terrestrial Physical AI, the relevant choices include bipedal and wheeled humanoids, other mobile manipulators and dedicated automation. The most useful question is which work each can perform economically, under which conditions, and how quickly customers can adopt it. The answer may favour several architectures at once.
A strong forecasting process therefore has two responsibilities. It must give decision-makers a workable view of the future, and it must remain capable of changing that view. Explicit assumptions, comparable evidence and a record of revisions make both possible.
Hypotheses need boundaries
A useful hypothesis describes a mechanism within a defined setting. “Humanoid robots will grow” leaves almost every important question open. “Wheeled humanoids gain adoption in indoor handling because accessible floors allow lower operating costs” gives a research team something more precise to challenge. The task, customer group and time horizon still need definition.
Three concepts help keep the discussion clear:
- A hypothesis is a testable proposition about how or why an outcome might occur.
- A trend is a sustained pattern in comparable observations over time.
- A forecast is a dated estimate of a future outcome, conditional on assumptions and evidence.
Evidence can strengthen or weaken a hypothesis. Repeated observations may establish a trend within a particular setting, while the explanation for that trend remains contested. Several manufacturers choosing wheels, for example, could reflect operating economics, available components, development experience or customer preferences. The same observation can support more than one explanation.
People also bring different experience to a workshop. Someone working with automotive plants may see a different future from someone serving hospitals or small warehouses. Region, customer size, labour availability and existing automation shape those perspectives. Recording that context helps distinguish a substantive disagreement from two people describing different markets.
The boundary matters just as much as the claim. A hypothesis might apply to new deployments in large warehouses through 2030 and remain uncertain for smaller sites in 2035. Keeping those limits explicit prevents an attractive local example from becoming an unsupported global assumption.
Real deployments leave room for competing interpretations
GXO and Agility announced a commercial service agreement in June 2024, describing Digit transferring totes between existing mobile automation and conveyors at a SPANX facility. That establishes a defined application and commercial relationship. The announcement leaves comparative lifetime economics against alternative solutions unresolved. [5]
GXO separately announced a Reflex pilot in September 2024. Reflex describes its platform as a wheeled humanoid, combining manipulation, supervision and learning from operations. These examples show different approaches entering logistics environments. Their relative performance, future deployment scale and relevance beyond those tasks require further evidence. [4] [2]
The design arguments also compete. Agility describes legs as useful for access, balance, reach and positioning, while acknowledging applications well suited to wheels. Boston Dynamics discusses alternative grippers and movement beyond human motion constraints for electric Atlas. These are useful supplier explanations of design choices, with commercial interests behind them. [1] [3]
The forecasting question is how far each observation travels. A successful tote-transfer deployment supports a claim about that workflow. Extending it to other objects, facilities or industries requires additional reasoning. Tracking those extensions explicitly is more informative than treating every deployment as interchangeable evidence of a general market.
Five hypotheses that could shape 2035
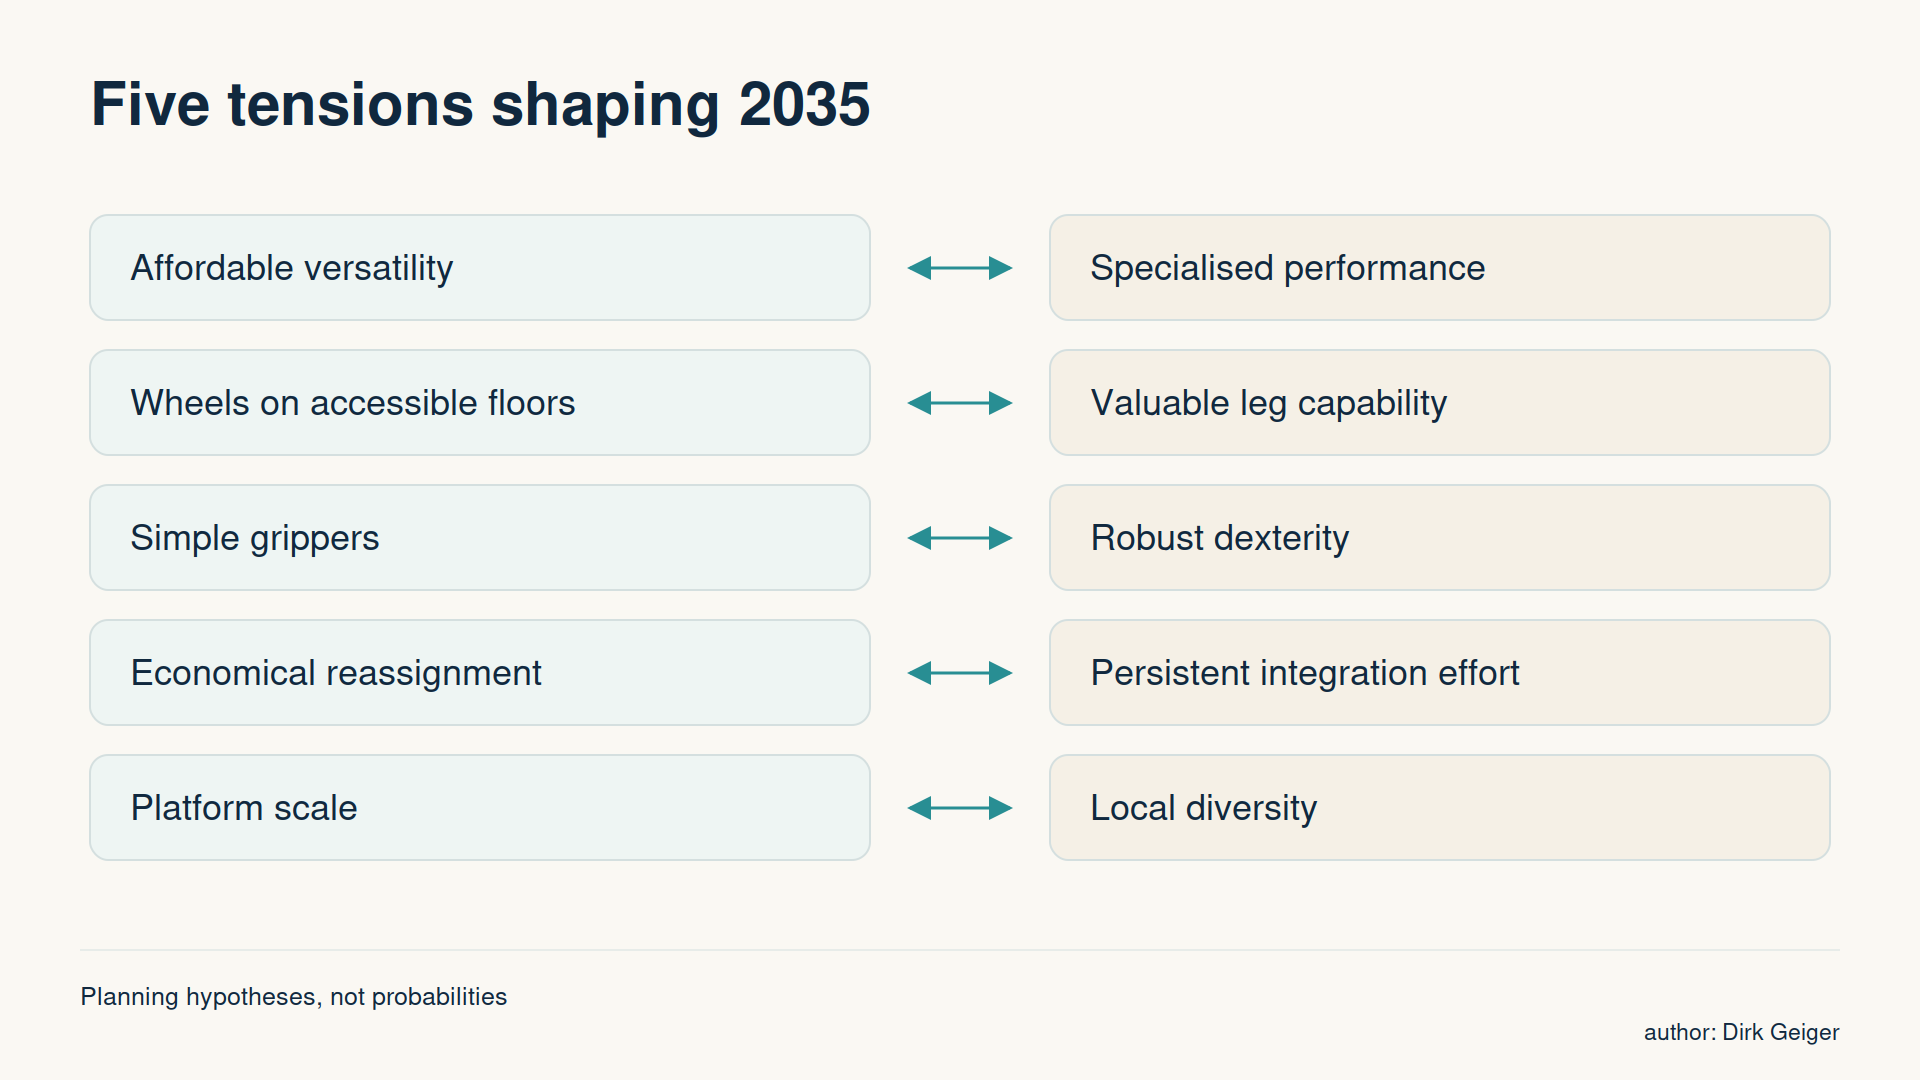
The following pairs offer a starting point for investigation. They carry no probability ranking. Their relevance depends on the customer, task and operating environment, and opposing outcomes can coexist across segments.
H01: Affordable versatility broadens adoption
Lower installed costs and support burdens could make a broadly capable robot attractive even when some capabilities remain unused. Procurement simplicity and future reassignment may justify that choice. The counterhypothesis is that dedicated equipment retains a decisive advantage in throughput, availability or cost per successful task. Comparable bids and productive output over representative shifts would help distinguish the two. Catalogue prices alone leave integration, maintenance and recovery costs unresolved.
H02: Wheels gain share where access permits
Wheeled humanoids may gain indoor handling work where continuous floors and sufficient turning space make rolling economical. Legs could justify their added complexity through reach, positioning and access to existing workplaces. Stairs are only one part of that comparison. Useful evidence identifies which capabilities customers use regularly, how much work they enable and what an alternative design would require. Facility modifications belong in the same economic assessment.
H03: Task-specific grippers cover much of the workload
Simple, robust tools may address a large share of attractive handling tasks. Affordable dexterity could instead expand task coverage and reduce tooling changes enough to justify more complex hands. Success rates across the actual object mix, damage, intervention time and replacement frequency reveal more than finger count. The hypothesis changes when difficult objects move from occasional exceptions to a substantial part of the workload.
H04: Reassignment increases the value of flexible robots
Changing products, seasonal demand and variable production could favour machines that remain useful across workflows. Persistent integration effort may limit that benefit. Each new task can require tooling, data, validation and supervision. Evidence should follow the time and cost of reaching stable productivity after reassignment, alongside how often customers actually move robots between jobs. Demonstrated versatility creates commercial value when organisations can use it economically.
H05: Scale favours shared platforms
Common manufacturing, software and service networks may make standard platforms competitive across customer groups. Local infrastructure, operating practices and service availability could sustain diversity. Comparable tasks across regions provide a better test than national showcase projects. Lower labour costs affect payback; limited service coverage affects availability. The resulting architecture choice depends on how those factors interact with the work.
Each pair opens a distinct research question. Together they explain why a single global form-factor assumption can hide several different adoption paths.
The most important uncertainty is the one that changes a decision
A workshop can generate dozens of plausible hypotheses. Giving all of them equal attention makes the forecast difficult to maintain. Priority should reflect the consequence of being wrong, the strength of available evidence and the possibility of learning something useful before a decision becomes costly to change.
Impact and confidence deserve separate judgements. A high-impact assumption with weak evidence may justify immediate research. A well-supported assumption may need monitoring. A highly uncertain issue with little effect on the decision can remain unresolved without blocking progress.
A simple sensitivity test makes the distinction concrete. Holding other inputs constant, how much would a different answer change expected adoption, deployment timing or form-factor mix? If a plausible alternative materially changes the outcome, the assumption deserves attention. Where several assumptions move together, scenarios provide a better test than changing one variable in isolation.
Counterevidence is especially valuable. A team expecting rapid task reassignment should look for examples of expensive retraining or validation. A team expecting dedicated machines to dominate should look for customers accepting lower peak throughput in exchange for flexibility. These observations reveal where a preferred explanation stops working.
Confidence should rise with the relevance and independence of the evidence. Several reports repeating one supplier announcement add visibility without adding independent observations. A smaller number of comparable customer operating records may carry more weight. Any numerical probability should have a defined meaning and calibration basis; otherwise a qualitative assessment is clearer.
A forecast needs a bridge between useful work and robot numbers
The starting point is a defined population of tasks or facilities. The next questions concern technical suitability, customer economics and the pace at which organisations can deploy. These filters help explain why a large theoretical opportunity can produce a gradual adoption path.
A manageable model separates the main quantities:
| Quantity | Question it answers | Important distinction |
|---|---|---|
| Addressable workload | How much relevant work exists? | Tasks and hours need a consistent boundary. |
| Economic eligibility | Where could automation meet customer requirements? | Technical capability alone leaves payback unresolved. |
| Adoption | How many eligible customers will deploy, and when? | Approval, integration and service capacity can constrain timing. |
| Robot productivity | How much useful work does each deployed unit deliver? | Availability, supervision and shift patterns affect the denominator. |
| Form-factor mix | Which architectures customers select within each use case? | Changes in task mix differ from changes in preferred architecture. |
A workload-based estimate divides the work assigned to robots by productive output per robot over the same period. Changing availability or utilisation can therefore change unit demand even when the workload stays constant. A faster machine can create more customer value while reducing the number required for a particular job.
Consistent counting rules prevent artificial growth. Tool changes create no additional robot shipment. Platforms with optional wheels or legs need one classification at delivery, with later module sales recorded separately. Bipedal humanoids, wheeled humanoids and other mobile manipulators need explicit category boundaries.
Installed fleets, shipments, orders and announced capacity also remain separate. Shipments support fleet growth and replacement, while capacity describes potential supply. Neither a factory ambition nor a backlog establishes how many robots are operating productively.
A simple sensitivity illustrates mix: one million annual humanoid shipments at a 40 percent bipedal share implies 400,000 bipeds; 70 percent implies 700,000. Those values isolate an arithmetic relationship. They assign no expected 2035 market size. In practice, changes in economics and productivity could move the total as well.
Several coherent futures are more useful than one fragile average
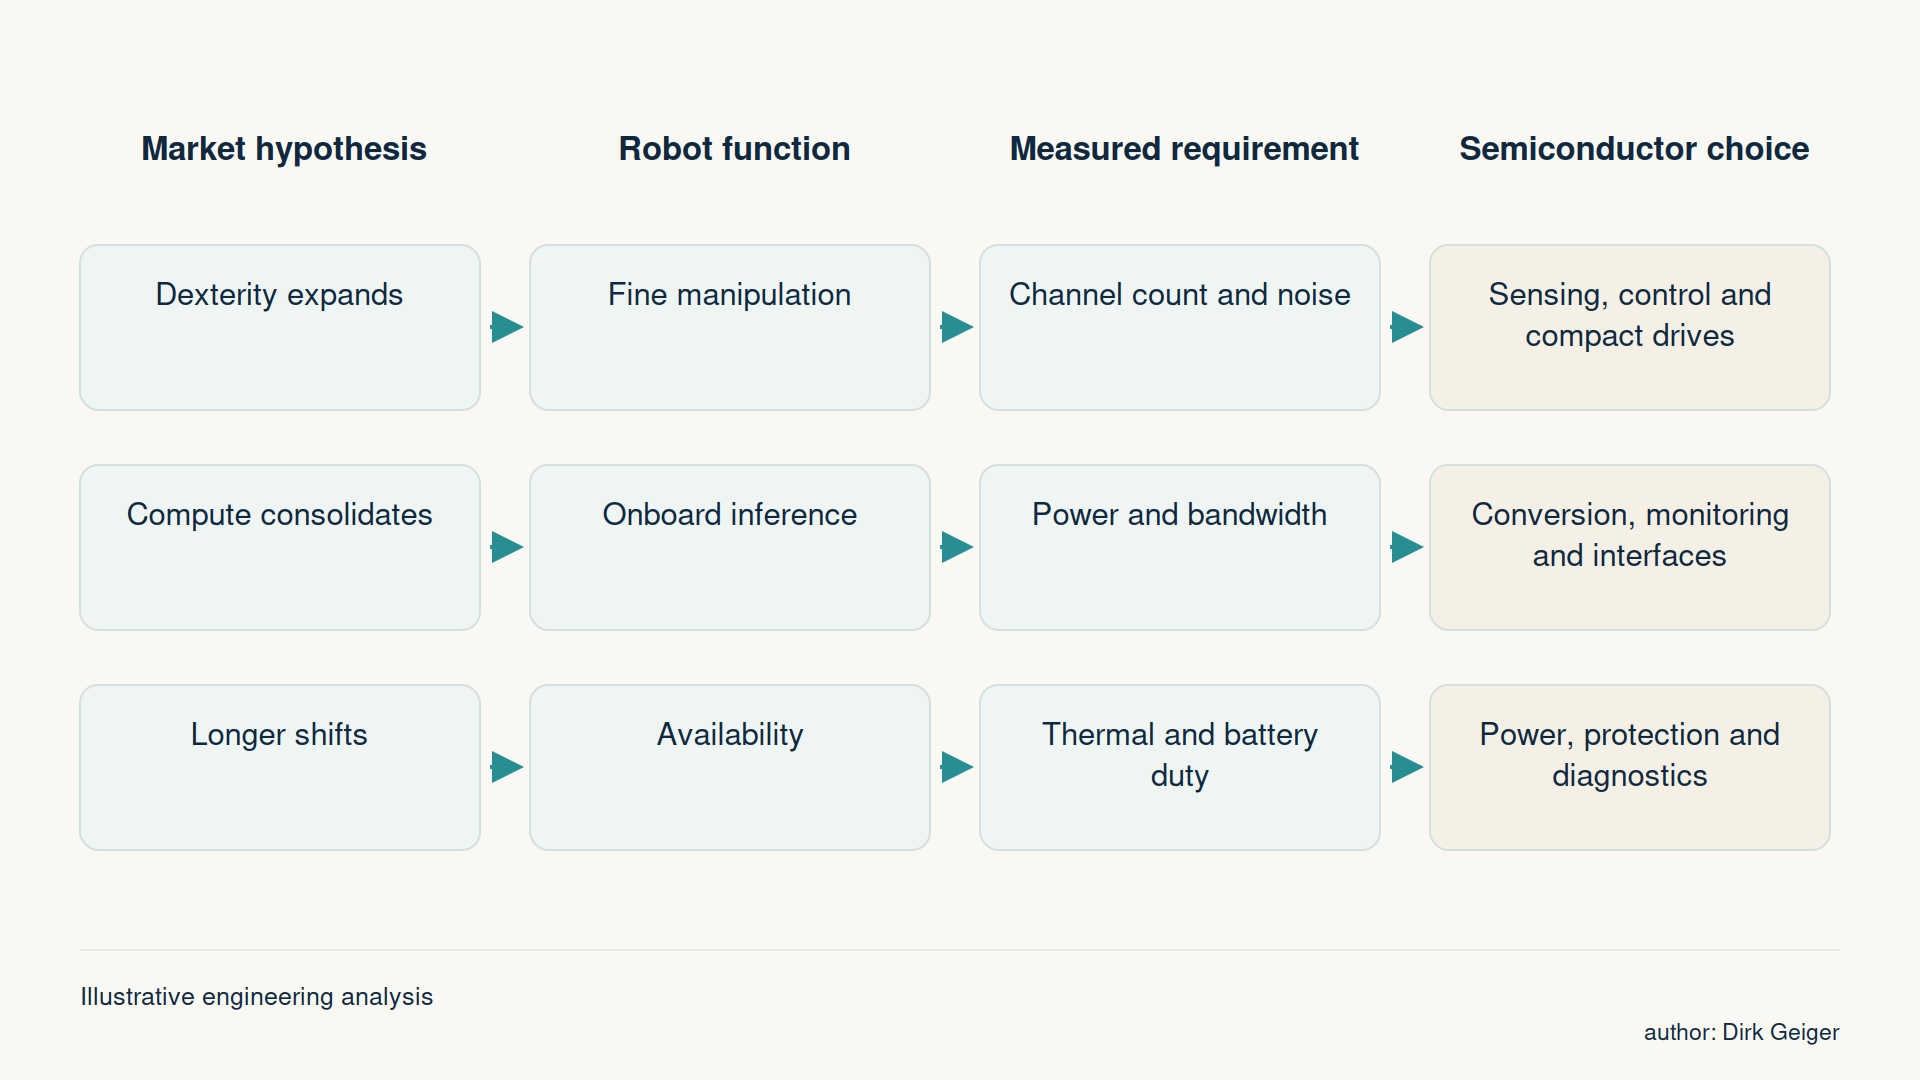
A central forecast helps organisations coordinate, but its dependencies need to remain visible. Three scenarios provide a compact way to examine how the five market hypotheses could interact.
| Scenario | Customer logic | Evidence that would strengthen it |
|---|---|---|
| Task-optimised market | Customers closely match machines to stable work, favouring dedicated tools and suitable mobility. | Repeated selections based on superior task economics and limited reassignment. |
| Mixed modular market | Shared platforms support different mobility options, tools and applications. | Meaningful reuse across deployments with manageable integration and service costs. |
| Universal-platform market | Scale and transferable skills make broad capability economical across many tasks. | Customers repeatedly adopting the same platform for substantially different workflows. |
These scenarios need internally consistent assumptions. Rapid adoption alongside persistently expensive integration requires an explanation, such as unusually high customer value or strong deployment support. Low unit prices alongside extensive supervision also need a credible operating model.
Regional variation can initially sit within the same framework. Labour cost, utilisation, service response and existing automation change customer economics. Distinct regional form-factor shares become justified when comparable tasks repeatedly select different architectures. A prominent domestic manufacturer alone cannot establish that pattern.
Scenario comparison should reveal which decisions remain useful across outcomes and which depend on one particular future. It also identifies what to monitor. If reassignment costs fall across independent deployments, the flexible-platform scenarios gain support. If customers keep buying specialised replacements, task optimisation deserves greater weight.
A hypothesis register gives the forecast a memory
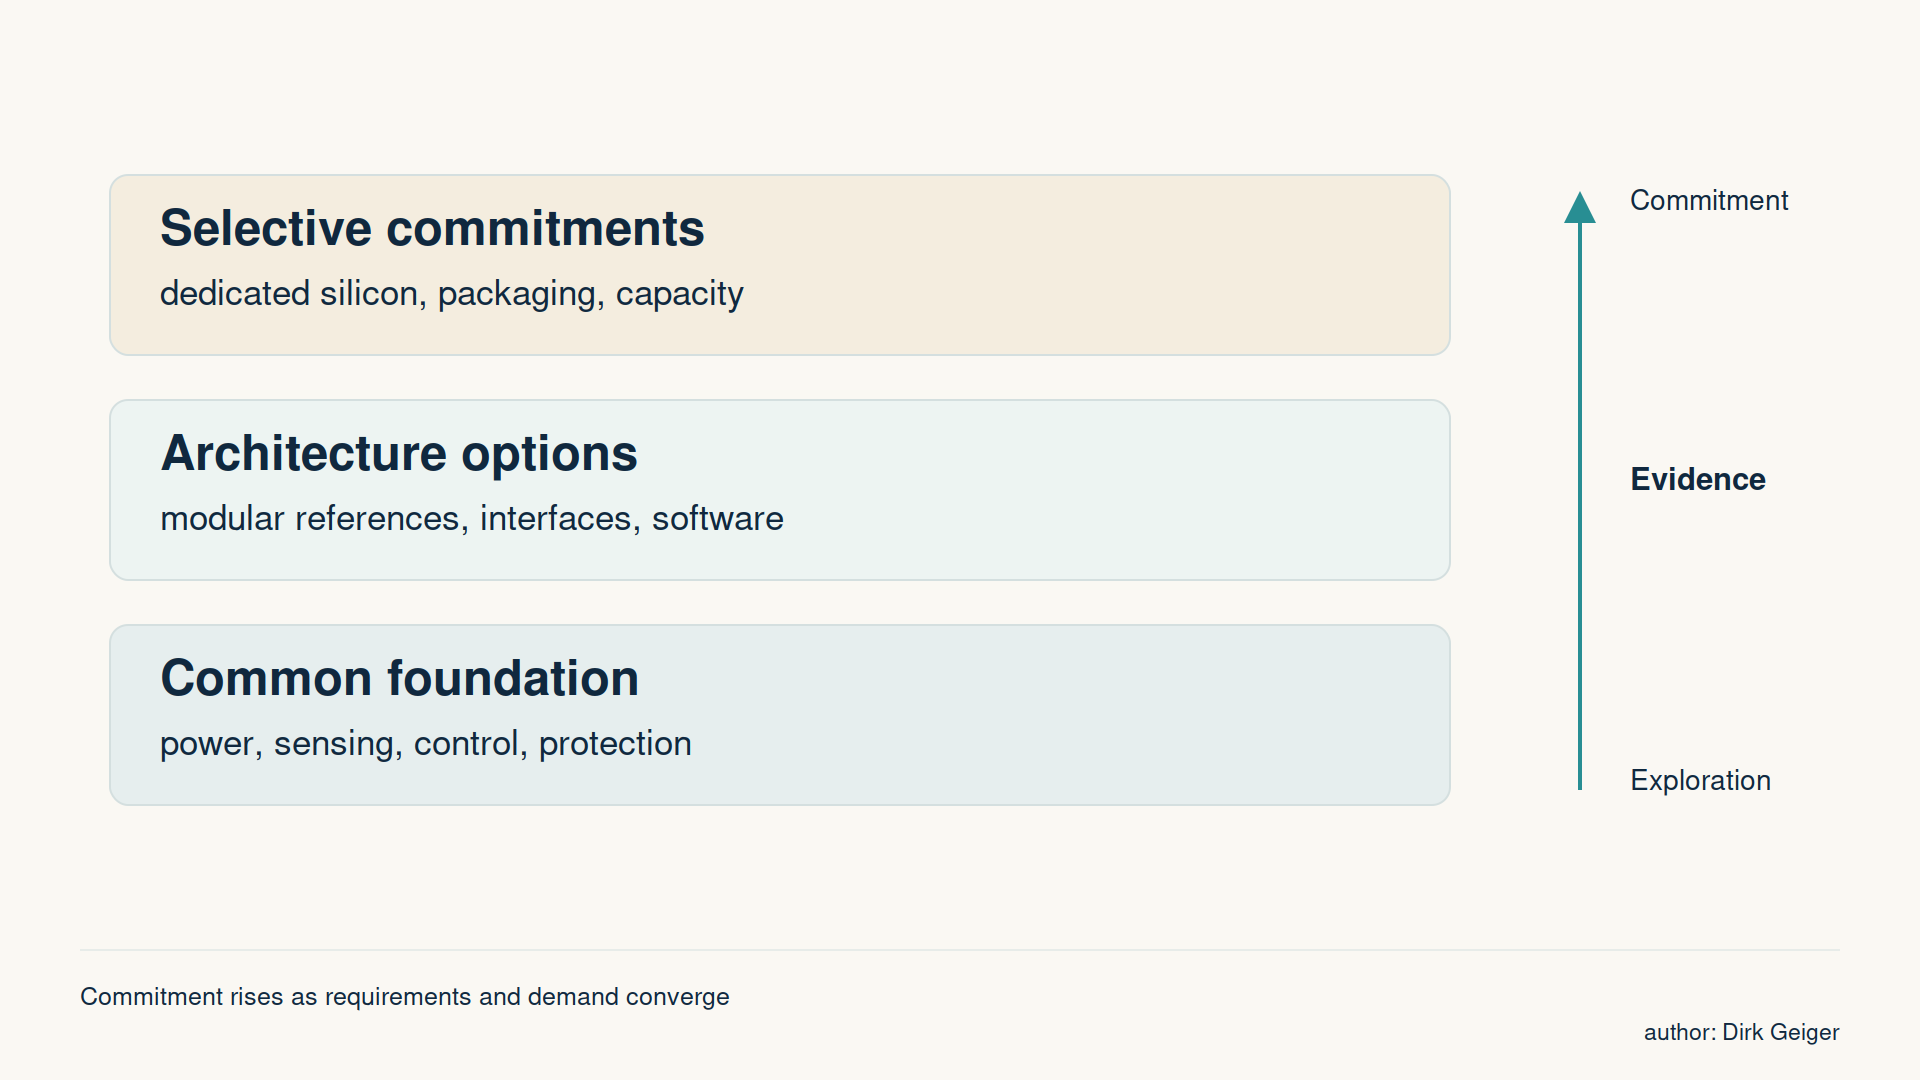
Each hypothesis needs a stable identifier, a clearly scoped claim and an explanation of why the outcome might occur. Evidence for and against it belongs beside the claim, along with an owner, a review date and the decision it could influence. A counterhypothesis makes the strongest alternative explanation explicit.
The workshop can begin with individual contributions before group discussion. Participants record what they believe, the segment behind that belief and what would change their view. Customer operations, regional experience and conventional automation expertise are particularly useful alongside robotics development perspectives.
The group then sharpens the wording and identifies the assumptions that materially change the forecast. Agreement on a research question can be more valuable than agreement on its answer. Where disagreement reflects different applications, splitting a broad hypothesis into scoped variants may be appropriate. Where the evidence is genuinely conflicting, both views should remain visible.
A broader review group can contribute asynchronously. Each response should identify the hypothesis, relevant context, evidence and proposed change. A facilitator maintains the master register and its revision history. This keeps discussion open while preventing several incompatible copies from becoming competing sources of truth.
The simplest useful tool supports hypothesis records, evidence links, comments, review dates and dated exports. It should allow reviewers to propose extensions without silently replacing the original claim. The practical objective is traceability: someone joining later can understand what changed, why it changed and which forecast assumption followed.
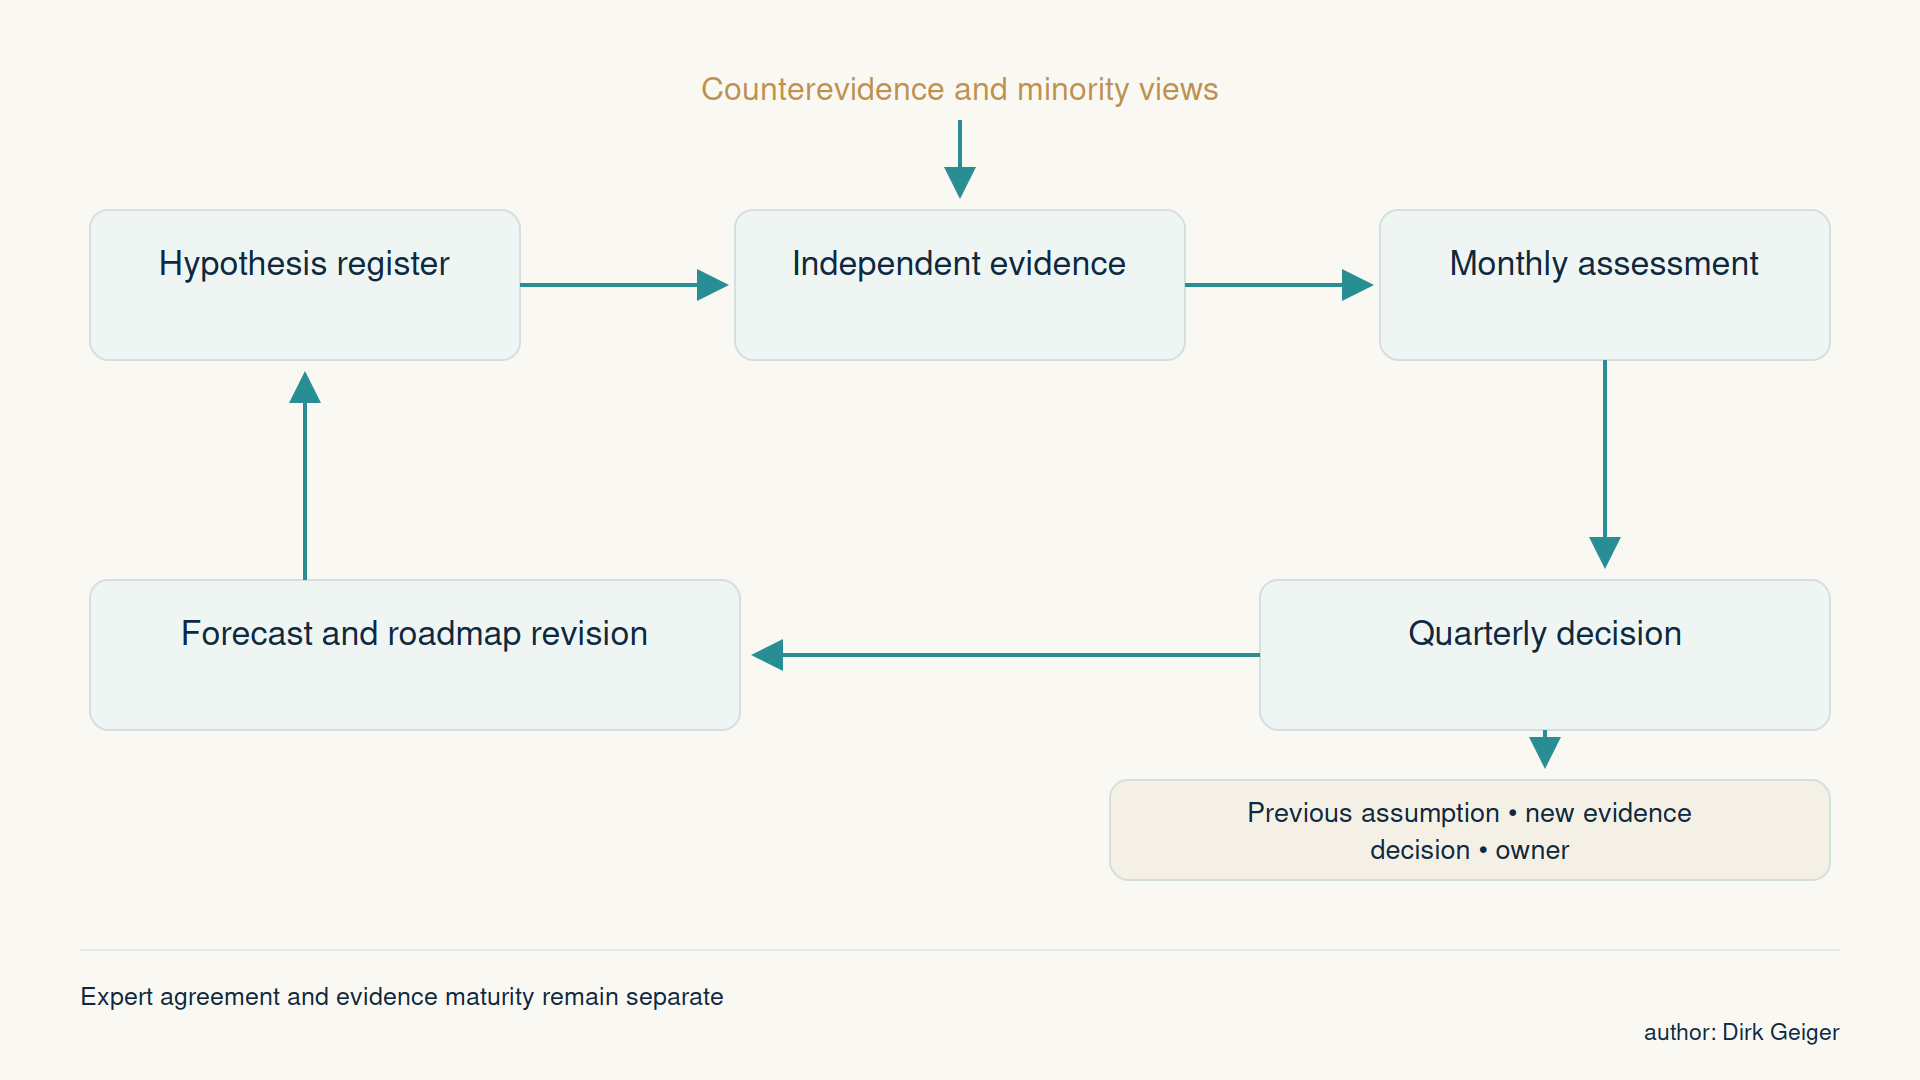
Monthly evidence maintenance and quarterly forecast decisions offer a workable starting cadence. Significant operating evidence can justify an earlier review. Expert agreement and evidence maturity remain separate throughout.
Evidence needs a route into forecast revisions
A deployment record becomes more useful when it follows the same programme over time: announcement, installation, operating results and repeat purchase. Each stage answers a different question. The distinction helps prevent intentions from quietly entering a model as completed adoption.
Comparable metrics need denominators. Productive hours, task completion, intervention time and maintenance become meaningful alongside the workload, object mix, shift pattern and operating conditions. Missing data should remain visible. An absence of public results does not establish failure, and a polished demonstration does not establish representative performance.
Research gates can connect evidence to action:
- Retain a hypothesis when relevant evidence remains consistent with its mechanism and scope.
- Revise it when new observations change the expected timing, magnitude or applicable segment.
- Split it when different environments produce systematically different outcomes.
- Retire it when its mechanism fails or it no longer affects the decision.
Before changing the forecast, the owner records which input moves and why. One event may inform several hypotheses, while its volume effect enters the model once. The revision record should retain the previous estimate, the new range and any unresolved disagreement.
Forecast performance also deserves review as outcomes become observable. Repeated overestimation of deployment speed may reveal an integration bottleneck. Persistent errors in form-factor mix may reveal a weak understanding of customer alternatives. Updating the underlying mechanism improves the next forecast more than adjusting a growth rate without explanation.
A useful forecast explains what would change it
By 2035, Physical AI may support a broad range of commercially useful machines. Wheels could prevail in some environments, legs in others, and dedicated automation could remain the best choice for stable tasks. The important uncertainty is how customer economics, capability and deployment effort combine within each market.
A small set of explicit hypotheses makes that uncertainty manageable. Scoped claims invite useful disagreement. Comparable evidence reveals emerging patterns. Scenarios expose dependencies, and a maintained register preserves the reasoning behind revisions.
The forecast then becomes a practical basis for decisions: clear enough to use today, with explicit conditions for changing tomorrow. Its credibility rests on the quality of that reasoning and on the willingness to revise it when customers and operating results tell a different story.